
Page 12 - ipic prueba
P. 12
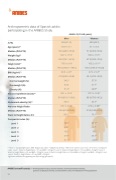
Anthropometric data of Spanish adults participating in the ANIBES Study
n (%)
Age (years)(1) Median (P25-P75) Weight (kg)(1) Median (P25-P75) Height (cm)(1) Median (P25-P75) BMI (kg/m2)(1) Median (P25-P75)
Normal weight (%) Overweight (%) Obesity (%)
Waist circumference (cm)(1) Median (P25-P75) Abdominal obesity (%)(2) Waist to Height Ratio Median (P25-P75)
Waist to Height Ratio ≥ 0.5 Composite index (%):
· Level 1 · Level 2 · Level 3 · Level 4 · Level 5
Men
363 (21.9)
50.9 ± 6.1 50.0 (46.0–56.0) 84.7 ± 15.6E 83.0 (74.1–93.2) 173.0 ± 6.6E 173.0 (168.0–178.0) 28.3 ± 4.9E 27.8 (25.0–30.8) 24.2E
44.0
31.6E
99.1 ± 12.9E 97.4 (90.5–106.0) 35.2E
0.57 ± 0.08E 0.56 (0.52–0.62) 83.2E
14.0E
2.8E
409 (24.7)
51.1 ± 6.5 51.0 (45.0–56.0) 69.6 ± 13.7SE 67.5 (59.6–76.9) 160.2 ± 6.1SE 160.0 (156.0–164.0) 27.2 ± 5.4SE 26.1 (23.2–30.0) 37.3SE
37.7E
24.8SE
87.7 ± 12.8SE 86.6 (78.0–96.3) 45.3SE
0.55 ± 0.08SE 0.53 (0.49–0.61) 70.1SE
27.1SE
2.7E
With the participation of:
Spanish Nutrition and Food Sciences Academy
10.2E
10.5
Spanish Foundation fo Nutritional Research
Adults 2 (41–64 years) Women
Spanish Nutrition Society
Spanish Society of Community Nutrition
(AEN) (SEÑ) (SENC) (FIN)
(1) Mean ± Standard Deviation; BMI: body mass index; (2) abdominal obesity: >88 cm for women and >102 cm for men; Composite index: Level 1: Waist to Height Ratio < 0.5 and BMI < 25 kg/m2, Level 2: Waist to Height Ratio < 0.5 and BMI ≥ 25 kg/m2, Level 3: Waist to Height Ratio ≥ 0.5 and BMI < 25 kg/m2, Level 4: Waist to Height Ratio ≥ 0.5 and BMI ≥ 25 kg/m2 and BMI < 30 kg/m2, and Level 5: Waist to Height Ratio ≥ 0.5 and BMI ≥ 30 kg/m2.
Significant differences regarding sex (S) and age groups (E).
ANIBES scientific study >> Anthropometric data, macronutrients and micronutrients intake,
practice of physical activity, socioeconomic data and lifestyles of the population
12
41.9E 34.7SE 31.1E 24.9E
