
Page 13 - ipic prueba
P. 13
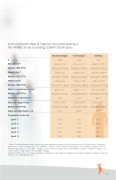
Anthropometric data of Spanish men participating in the ANIBES Study according to BMI classification
n
Age (years)(1)
Median (P25-P75)
Weight (kg)(1)
Median (P25-P75)
Height (cm)(1)
Median (P25-P75)
Waist circumference (cm)(1) Median (P25-P75) Abdominal obesity (%)
Waist to Height Ratio Median (P25-P75)
Waist to Height Ratio ≥ 0.5 Composite index (%):
· Level 1 · Level 2 · Level 3
Normal weight Overweight Obesity
290 323 181
34.5 ± 11.9 41.4 ± 11.1A 45.0 ± 11.4AB
33.0 (24.0–43.0) 40.0 (33.0–50.0) 46.0 (37.0–55.0)
70.0 ± 7.0 82.9 ± 7.3A 101.8 ± 14.9AB
70.5 (65.7–74.6) 82.9 (77.9–87.2) 100.0 (92.3–107.5)
175.5 ± 6.6 174.5 ± 7.0 172.9 ± 7.2AB
175.0 (171.0–180.0) 175.0 (169.0–180.0) 173.0 (168.0–178.0)
82.6 ± 7.1 94.6 ± 7.1A 111.0 ± 11.8AB
82.2 (77.6–87.2) 95.0 (90.0–99.1) 109.7 (103.3–117.0)
0.3 14.3A 82.3AB
0.47 ± 0.04 0.54 ± 0.04A 0.64 ± 0.07AB
0.47 (0.44–0.49) 0.54 (0.52–0.57) 0.64 (0.60–0.68)
22.1 84.5A 99.4AB
78.3 0.0A 0.0A
W ith the 0co.l0laboration of: 15.5A 0.6A
21.7 0.0A 0.0A
0.0 84.5A 0.0B
0.0 0.0 99.4AB
r Nutr·itiLoenvSteudlie4s ImprovementofHealthbyFitness, Association Nutrition and Exercise
(ASEN) Research Group
· Level 5
(1) Mean ± Standard Deviation; BMI: body mass index; abdominal obesity: >88 cm for women and >102 cm for men; Composite index: Level 1: Waist to Height Ratio < 0.5 and BMI < 25 kg/m2, Level 2: Waist to Height Ratio < 0.5 and BMI ≥ 25 kg/m2, Level 3: Waist to Height Ratio ≥ 0.5 and BMI < 25 kg/m2, Level 4: Waist to Height Ratio ≥ 0.5 and BMI ≥ 25 kg/m2 and BMI < 30 kg/m2, and Level 5: Waist to Height Ratio ≥ 0.5 and BMI ≥ 30 kg/m2.
Significant differences in the same sex group: A: regarding normal weight, B: regarding overweight. Significance between men and women in the same BMI group (S).
13
o
