
Page 11 - ipic prueba
P. 11
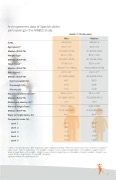
Anthropometric data of Spanish adults participating in the ANIBES Study
n (%)
Age (years)(1) Median (P25-P75) Weight (kg)(1) Median (P25-P75) Height (cm)(1) Median (P25-P75) BMI (kg/m2)(1) Median (P25-P75)
Normal weight (%) Overweight (%) Obesity (%)
Waist circumference (cm)(1) Median (P25-P75) Abdominal obesity (%)(2) Waist to Height Ratio Median (P25-P75)
Waist to Height Ratio ≥ 0.5 Composite index (%):
· Level 1
· Level 2
r Nutr·itiLoenvSteudlie3s ImprovementofHealthbyFitness, Association Nutrition and Exercise
W
Adults 1 (18-40 years)
Men Women
435 (26.3) 448 (27.1)
30.2 ± 6.7 30.4 ± 6.4
31.0 (25.0–36.0) 31.0 (25.0–36.0)
80.4 ± 14.8 63.9 ± 12.9S
78.3 (70.7–87.0) 61.7 (54.8–70.0)
175.8 ± 6.9 162.4 ± 6.4S
176.0 (171.0–180.0) 163.0 (158.0–167.0)
26.0 ± 4.6 24.2 ± 4.7S
25.1 (22.8–28.0) 23.3 (20.8–26.5)
46.7 58.2S
37.4 25.8S
15.2 10.4S
89.4 ± 12.5 78.2 ± 11.9S
87.3 (80.5–96.7) 76.2 (69.9–84.1)
15.7 18.7
0.51 ± 0.07 0.48 ± 0.08S
0.5 (0.46–0.55) 0.47 (0.43–0.52)
49.2 36.4S
ith the collaboration of:
41.4 56.9S
9.4 6.7
6.0 6.9
27.8 19.6S
15.4 9.8S
(ASEN) Research Group
· Level 4 · Level 5
(1) Mean ± Standard Deviation; BMI: body mass index; (2) abdominal obesity: >88 cm for women and >102 cm for men; Composite index: Level 1: Waist to Height Ratio < 0.5 and BMI < 25 kg/m2, Level 2: Waist to Height Ratio < 0.5 and BMI ≥ 25 kg/m2, Level 3: Waist to Height Ratio ≥ 0.5 and BMI < 25 kg/m2, Level 4: Waist to Height Ratio ≥ 0.5 and BMI ≥ 25 kg/m2 and BMI < 30 kg/m2, and Level 5: Waist to Height Ratio ≥ 0.5 and BMI ≥ 30 kg/m2.
Significant differences regarding sex (S).
11
o
