
Page 16 - ipic prueba
P. 16
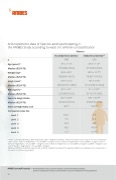
Anthropometric data of Spanish adults participating in
the ANIBES Study according to waist circumference classification
No abdominal obesity
588
37.5 ± 11.6 37.0 (29.0–46.0) 60.3 ± 8.5S 59.8 (54.3–65.7) 161.5 ± 6.2S 162.0 (157.0–166.0) 23.1 ± 3.1S 22.9 (20.8–25.2) 0.47 ± 0.05S 0.47 (0.43–0.51) 30.7S
62.2S
7.0
10.4
19.2S
Abdominal obesity(2)
269
43.3 ± 11.2* 47.0 (38.0–56.0) 80.3 ± 12.7*S 78.8 (71.0–87.5) 161.0 ± 6.8S 161.0 (156.0–166.0) 31.1 ± 5.0*S 30.1 (27.6–33.6) 0.61 ± 0.07*S 0.60 (0.57–0.64) 100.0*
0.0
0.0 4.8*S 43.5*S
n
Age (years)(1)
Median (P25-P75) Weight (kg)(1)
Median (P25-P75)
Height (cm)(1)
Median (P25-P75)
BMI (kg/m2)(1)
Median (P25-P75)
Waist to Height Ratio Median (P25-P75)
Waist to Height Ratio ≥ 0.5 Composite index (%):
· Level 1 · Level 2 · Level 3 · Level 4 · Level 5
(1) Mean ± Standard Deviation; BMI: body mass index; (2) abdominal obesity: >88 cm for women and >102 cm for men; Composite index: Level 1: Waist to Height Ratio < 0.5 and BMI < 25 kg/m2, Level 2: Waist to Height Ratio < 0.5 and BMI ≥ 25 kg/m2, Level 3: Waist to Height Ratio ≥ 0.5 and BMI < 25 kg/m2, Level 4: Waist to Height Ratio ≥ 0.5 and BMI ≥ 25 kg/m2 and BMI < 30 kg/m2, and Level 5: Waist to Height Ratio ≥ 0.5 and BMI ≥ 30 kg/m2.
Significant differences between adults with or without abdominal obesity (*). Significant differences between men and women in the waist circumference group (S).
ANIBES scientific study >> Anthropometric data, macronutrients and micronutrients intake,
practice of physical activity, socioeconomic data and lifestyles of the population
16
With the participation of:
Spanish Nutrition and Food Sciences Academy
1.2S
51.7*S
Spanish Foundation fo Nutritional Research
Spanish Nutrition Society
Spanish Society of Community Nutrition
Women
(AEN) (SEÑ) (SENC) (FIN)
