
Page 17 - ipic prueba
P. 17
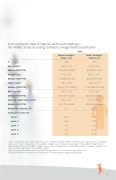
Anthropometric data of Spanish adults participating in
the ANIBES Study according to Waist to Height Ratio classification
Men
Waist to Height Waist to Height Ratio < 0.5 Ratio ≥ 0.5
282 516
32.5 ± 11.2 43.5 ± 10.9
31.0 (23.0–40.0) 44.0 (36.0–52.0)
71.5 ± 8.5 88.3 ± 15.1*
71.3 (65.9–77.0) 86.3 (79.0–96.0)
176.1 ± 6.4 173.6 ± 7.1*
176.0 (172.0–180.0) 173.0 (169.0–179.0)
23.0 ± 21.8 29.3 ± 4.5*
23.0 (21.7–24.5) 28.3 (26.3–31.2)
80.6 ± 5.6 101.0 ± 11.2*
81.1 (77.2–84.5) 99.0 (93.3–106.2)
0.0 38.0*
81.9 0.0*
18.1 0.0*
ith the collaboration of:
0.0 12.2*
0.0 52.9*
0.0 34.9*
n
Age (years)(1)
Median (P25-P75)
Weight (kg)(1)
Median (P25-P75)
Height (cm)(1)
Median (P25-P75)
BMI (kg/m2)(1)
Median (P25-P75)
Waist to Height Ratio (cm)(1) Median (P25-P75) Abdominal obesity (%)(2) Composite index (%):
· Level 1
· Level 2
· Level 3
· Level 4
W
r Nutrition Studies Association
Improvement of Health by Fitness, Nutrition and Exercise Research Group
· Level 5
(ASEN)
(1) Mean ± Standard Deviation; BMI: body mass index; (2) abdominal obesity: >88 cm for women and >102 cm for men; Composite index: Level 1: Waist to Height Ratio < 0.5 and BMI < 25 kg/m2, Level 2: Waist to Height Ratio < 0.5 and BMI ≥ 25 kg/m2, Level 3: Waist to Height Ratio ≥ 0.5 and BMI < 25 kg/m2, Level 4: Waist to Height Ratio ≥ 0.5 and BMI ≥ 25 kg/m2 and BMI < 30 kg/m2, and Level 5: Waist to Height Ratio ≥ 0.5 and BMI ≥ 30 kg/m2.
Significant differences between adults with Waist to Height Ratio < 0.5 and Waist to Height Ratio ≥ 0.5 (*). Significant differences between men and women in the same Waist to Height Ratio group (S).
17
o
