
Page 15 - ipic prueba
P. 15
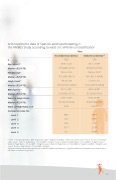
Anthropometric data of Spanish adults participating in
the ANIBES Study according to waist circumference classification
n
Age (years)(1)
Median (P25-P75) Weight (kg)(1)
Median (P25-P75)
Height (cm)(1)
Median (P25-P75)
BMI (kg/m2)(1)
Median (P25-P75)
Waist to Height Ratio Median (P25-P75)
Waist to Height Ratio ≥ 0.5 Composite index (%):
· Level 1
· Level 2
· Level 3 W · Level 4
Men
No abdominal obesity Abdominal obesity(2)
602 196
37.8 ± 12.0 45.1 ± 10.9*
37.0 (28.0–47.3) 46.0 (37.0–55.0)
76.5 ± 10.0 100.4 ± 15.2*
76.5 (70.0–83.1) 99.1 (91.3–106.8)
174.6 ± 6.8 174.3 ± 7.2
175.0 (170.0–180.0) 174.0 (170.0–180.0)
25.1 ± 3.01 33.0 ± 4.63*
25.0 (23.0–27.2) 32.5 (30.0–35.3)
0.50 ± 0.05 0.64 ± 0.06*
0.51 (0.47–0.54) 0.63 (0.60–0.67)
53.2 100.0*
38.4 0.0*
8.5 0.0*
ith the collaboration of:
10.3 0.5*
37.7 23.5*
5.1 76.0*
r Nutr·itiLoenvSteudlie5s ImprovementofHealthbyFitness, Association Nutrition and Exercise
(ASEN) Research Group
(1) Mean ± Standard Deviation; BMI: body mass index; (2) abdominal obesity: >88 cm for women and >102 cm for men; Composite index: Level 1: Waist to Height Ratio < 0.5 and BMI < 25 kg/m2, Level 2: Waist to Height Ratio < 0.5 and BMI ≥ 25 kg/m2, Level 3: Waist to Height Ratio ≥ 0.5 and BMI < 25 kg/m2, Level 4: Waist to Height Ratio ≥ 0.5 and BMI ≥ 25 kg/m2 and BMI < 30 kg/m2, and Level 5: Waist to Height Ratio ≥ 0.5 and BMI ≥ 30 kg/m2.
Significant differences between adults with or without abdominal obesity (*). Significant differences between men and women in the waist circumference group (S).
15
o
